Ever since WordPress sent me that awesome 2012 year end report, I’ve been jonesen for an app that will do the same with my personal calendar. Wouldn’t it be fun to spice up that boring end of year self-evaluation with something more visually stimulating and expressive?
Inevitably as I begin to write my self-evaluation I also think about my goals for the next year. One thing that has been on my mental ‘to do’ list all year is to learn how to build and produce infographics. I came across a great end of year report as infographic and felt even more inspired to make one for myself.
Unable to find an app that I could upload my calendar and create a report with, I took to analyzing my calendar, month by month, week by week, (painful, trust me) and pulling out things like reference desk shifts, instruction, meetings, training, committee work, volunteer work, presentations, etc. Then I had to put this information into data format so that I could use it to create my data-driven infographic. I used the free online app infogr.am to create my year end report. You will also notice that I included things like quotes, images, and text to round out some of the highlights of my librarian year.
[CLICK ON THE IMAGE FOR FULL INFOGRAPHIC]
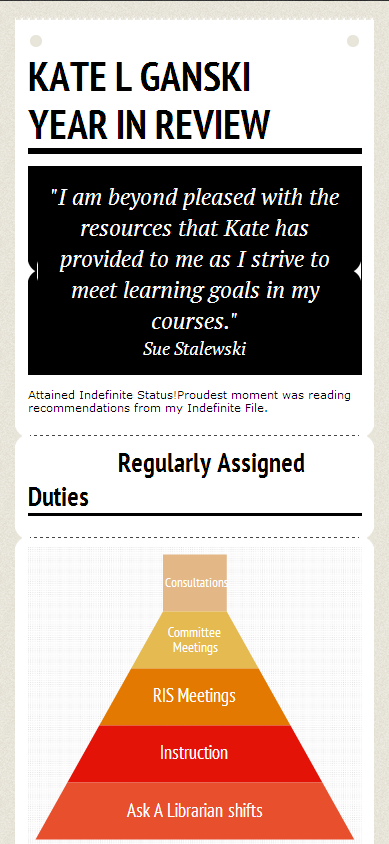
Kate L Ganski
2013 Year in Review
